pyTable Documentation
PyTable
- last update:2020.05.14 ... pytab ver. 1.0.1 - [Japanese documentation]
PyTable is a tool to plot a table easily.
In this article, the ways to use pyTable and what you can do are written.
This is an official documentation of pyTable.
Installation
1 | $ pip install pytab |
source (Github) : HiroshiARAKI/pytable: pytable is the library to plot table easily.
PyPI : pytab · PyPI
Basically usage
PyTable is worked on matplotlib, and pyTable is just wrapped library to use that easily.
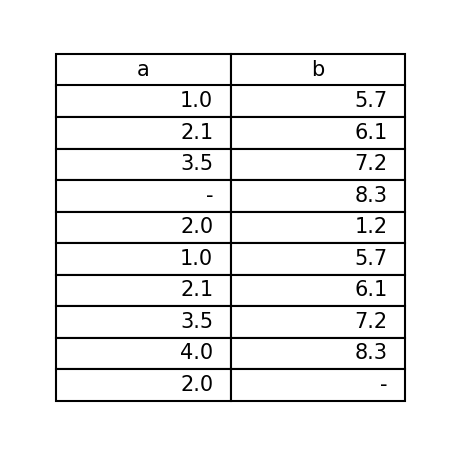
As below, you can create a table by passing data as a dict variable.
Now, the dict variable is used as a column data of a table.
1 2 3 4 5 6 7 8 9 10 11 12 13 | import pytab as pt if __name__ == '__main__': data = { 'a': [1.0, 2.1, 3.5, '-', 2.0, 1.0, 2.1, 3.5, 4.0, 2.0, ], 'b': [5.7, 6.1, 7.2, 8.3, 1.2, 5.7, 6.1, 7.2, 8.3, '-', ], } # The simplest table pt.table(data=data) pt.show() |
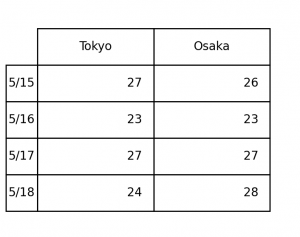
Create "rows"
You can add a header of row data in the left side of a table.
1 2 3 4 5 6 7 8 9 10 11 12 13 14 15 16 17 | import pytab as pt if __name__ == '__main__': data = { 'Tokyo': [27, 23, 27, 24], 'Osaka': [26, 23, 27, 28], } rows = ['5/15', '5/16', '5/17', '5/18'] pt.table( data=data, rows=rows, ) pt.show() |
Change background colors
When you want to change background colors of a header of a table, you solve that by passing color names or color codes to th_c or td_c.
1 2 3 4 5 6 7 8 9 10 11 12 13 14 15 16 17 18 19 | import pytab as pt if __name__ == '__main__': data = { 'Tokyo': [27, 23, 27, 24], 'Osaka': [26, 23, 27, 28], } rows = ['5/15', '5/16', '5/17', '5/18'] pt.table( data=data, rows=rows, th_c='#aaddff', td_c='lightgray', ) pt.show() |
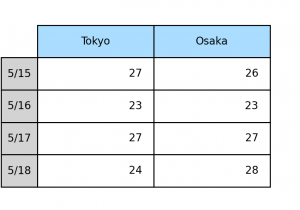
Color names are same to matplotlib's.


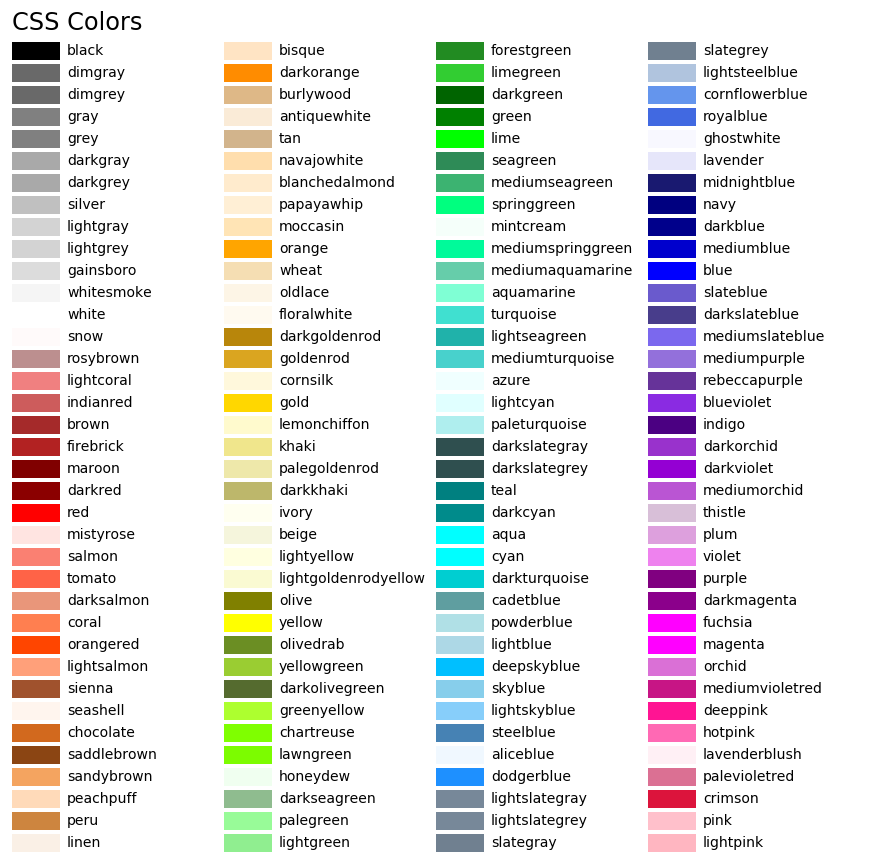
(参照:List of named colors – Matplotlib 3.1.0 documentation)
Change design of table cells
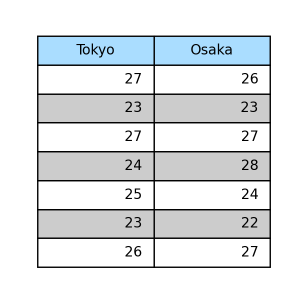
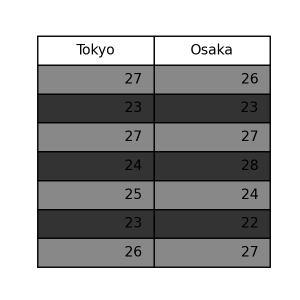
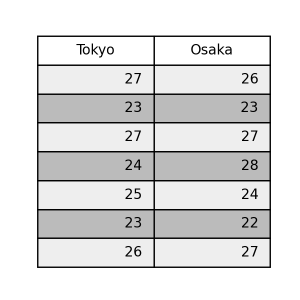
Also, you can change table cells to simple and attractive design ones by using table_type.
striped
1 2 3 4 5 | pt.table( data=data, th_c='#aaddff', table_type='striped', ) |
dark
1 2 3 4 | pt.table( data=data, table_type='dark', ) |
light
1 2 3 4 | pt.table( data=data, table_type='light', ) |
Change design of a table header
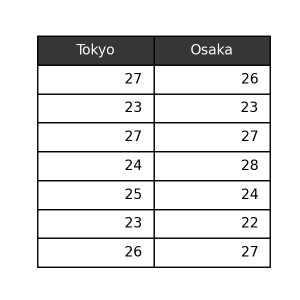
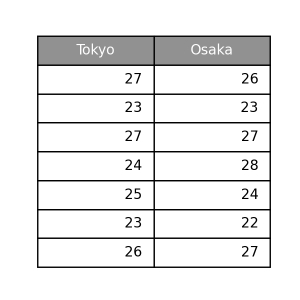
To only change the colors of a table header attracts people.
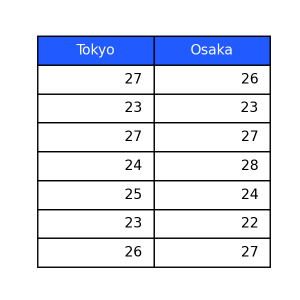
At this time, you need pass a design name to th_type.
dark
1 2 3 4 | pt.table( data=data, th_type='dark' ) |
gray
light
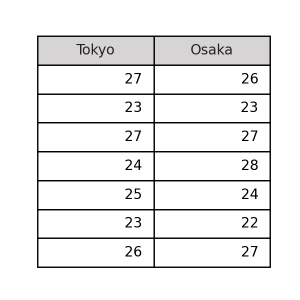
sky
Others
In addition, 'blue' , 'red' , 'green' , 'orange' are available.
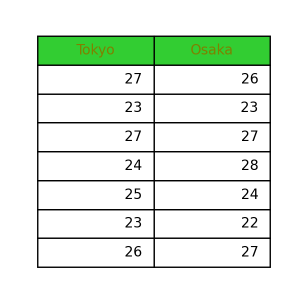
And, you can assign the color names or color codes to the background color ( th_face) and a text color ( th_text), respectively.
1 2 3 4 5 | pt.table( data=data, th_face='limegreen', th_text='olive', ) |
Other args introduction
The function table() has some options you can use, besides that.
data_loc, th_loc, td_loc
The locations of cell data, a header (columns) and rows are adjustable.
Normally, they are set to right align, center align and center align, respectively, and you can assign them to 'left' , 'center' or 'right'.
figsize
You set the size of a figure by figsize , and need assign that as Tuple[float, float].
Normally, it is set to (3, 3), but this is for a small table.
So, in the case that you create bigger table, you need adjust this argument to make it look good.
It is fine to set to None and adjust it by show().
edge
This is an argument about the edges of a table.
Normally, this is set to 'closed', but you can also use ['open', 'closed', 'horizontal', 'vertical'].
They mean All edges are invisible, All edges are visible, Only horizontal edges are visible and Only vertical edges are visible, respectively.
If you use options except 'closed', you cannot change a background colors.
Tips about significant digits
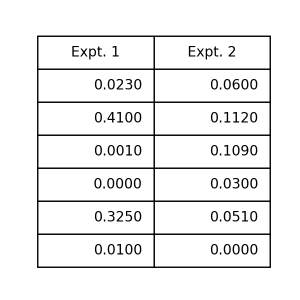
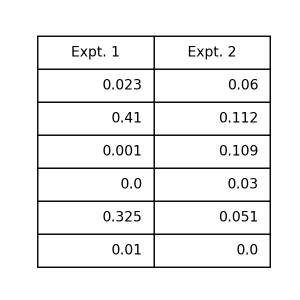
When you create a table using experimental results, you may be careful about significant digits.
At such time, you translate data to str before creating a table.
Before modification
1 2 3 4 5 6 7 8 9 10 11 12 13 14 | import pytab as pt if __name__ == '__main__': data = { 'Expt. 1': [0.023, 0.410, 0.001, 0.000, 0.325, 0.010, ], 'Expt. 2': [0.060, 0.112, 0.109, 0.030, 0.051, 0.000, ], } pt.table( data=data, ) pt.show() |
After modification
1 2 3 4 5 6 7 8 9 10 11 12 13 14 15 16 17 18 | import pytab as pt if __name__ == '__main__': data = { 'Expt. 1': [0.023, 0.410, 0.001, 0.000, 0.325, 0.010, ], 'Expt. 2': [0.060, 0.112, 0.109, 0.030, 0.051, 0.000, ], } # 有効数字で揃えて変換 for k in data: data[k] = ['{:.4f}'.format(d) for d in data[k]] pt.table( data=data, ) pt.show() |
