C++でグラフ描画をするならmatplotlib-cppを使ってみる?
はじめに
最近ではPythonが人気ですね.
なぜ人気かと言われれば,複雑な処理も簡潔なコードで済むからです.
型の明記も要らなければ,ほとんどの数学的処理もNumPyで済み,グラフもmatplotlibがあればあっという間に描画可能です.
一方C++はどうでしょうか?
型の明記は必要だし,グラフ描画も慣れていないと一苦労です.
そこで,C++でmatplotlibを使って簡単にグラフを書こう,というのがこの記事の趣旨です.
前置きが長いと嫌われますので,さっそく見ていきましょう.
matplotlib-cpp
PythonのmatplotlibをC++から呼び出せるヘッダオンリなライブラリが存在します.
それがmatplotlib-cppです.
いまだにちょくちょく更新されていて,機能がmatplotlibに近づいている印象です.
主に必要なものはPythonとNumPy.
細かい話は置いといて使い方をひたすら解説していきます.
installation
この記事で必要なのは"matplotlibcpp.h"だけなので,それだけ落としてください.
この後CMakeLists.txtも書きますが,サンプルコードを書くmain.cppと合わせて,以下のようなディレクトリ 構造です.
1 2 3 4 5 | . ├── build/ #ビルド用の空ディレクトリ ├── CMakeLists.txt ├── main.cpp └── matplotlibcpp.h |
これだけでとりあえずOK.
あと,僕の手元では以下のコード(line: 301-307)でRedefinitionエラーになっていたので,コメントアウトして対処しました.
※ 2020.04.22の更新で追加されたコードらしいので,もしかしたらみなさんの落としたコードによっては以下のコードは別のコードに書き換わっているかもしれません.
1 2 3 4 5 6 7 | // Sanity checks; comment them out or change the numpy type below if you're compiling on // a platform where they don't apply static_assert(sizeof(long long) == 8); template <> struct select_npy_type<long long> { const static NPY_TYPES type = NPY_INT64; }; static_assert(sizeof(unsigned long long) == 8); template <> struct select_npy_type<unsigned long long> { const static NPY_TYPES type = NPY_UINT64; }; // TODO: add int, long, etc. |
↓
1 2 3 4 5 6 7 | // Sanity checks; comment them out or change the numpy type below if you're compiling on // a platform where they don't apply // static_assert(sizeof(long long) == 8); // template <> struct select_npy_type<long long> { const static NPY_TYPES type = NPY_INT64; }; // static_assert(sizeof(unsigned long long) == 8); // template <> struct select_npy_type<unsigned long long> { const static NPY_TYPES type = NPY_UINT64; }; // TODO: add int, long, etc. |
力技な対処ですが,処理に問題がなかったので良しとします.
CMakeLists.txt
個人的にはこれを書いてMakeするのがお勧めです.
今回は,C++11でプロジェクト名が「plt」としています.
こんな感じ.
1 2 3 4 5 6 7 8 9 10 11 | cmake_minimum_required(VERSION 3.14) project(plt) set(CMAKE_CXX_STANDARD 11) add_executable(plt main.cpp) # matplotlibcppで使うPythonとNumpyを探す find_package(Python3 COMPONENTS Development NumPy) target_include_directories(plt PRIVATE ${Python3_INCLUDE_DIRS} ${Python3_NumPy_INCLUDE_DIRS}) target_link_libraries(plt Python3::Python Python3::NumPy) |
cmakeの最低保証バージョンはなんでもいいです.
ビルドと実行の仕方は,
1 2 3 4 | $ cd build $ cmake .. $ make $ ./plt |
です,簡単ですね.
ちなみに一度cmakeしたら,それ以降はmakeだけでOKです.
それではサンプルコードをmain.cppに書いていきます.
動作確認
とりあえず動作確認として,簡単なコード書きましょう.
1 2 3 4 5 6 7 8 9 10 11 | #include <iostream> #include "matplotlibcpp.h" namespace plt = matplotlibcpp; int main() { plt::plot({1, 2, 4, 8, 16}); plt::show(); return 0; } |
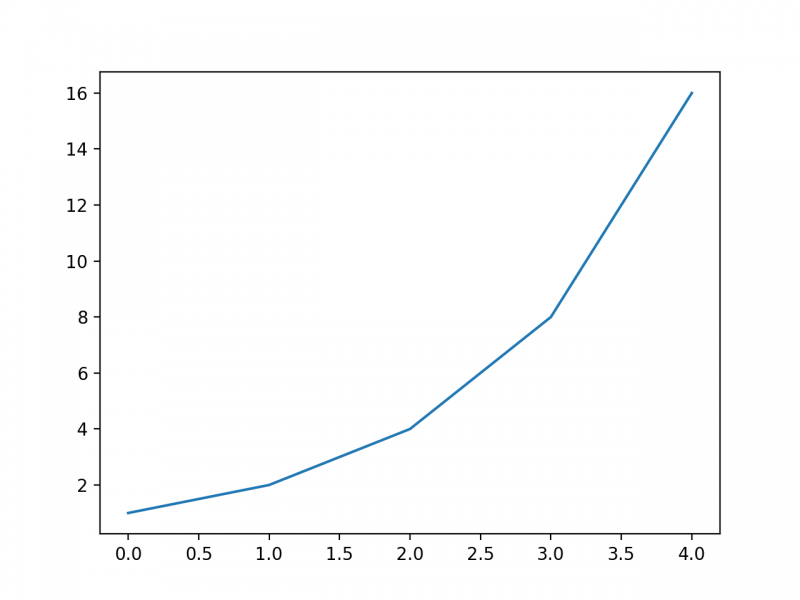
うまく描画されていますね.
ひとまず,PythonとNumPyが認識されているようです.
vectorでx, yを指定する
これが普通の使い方でしょうか.
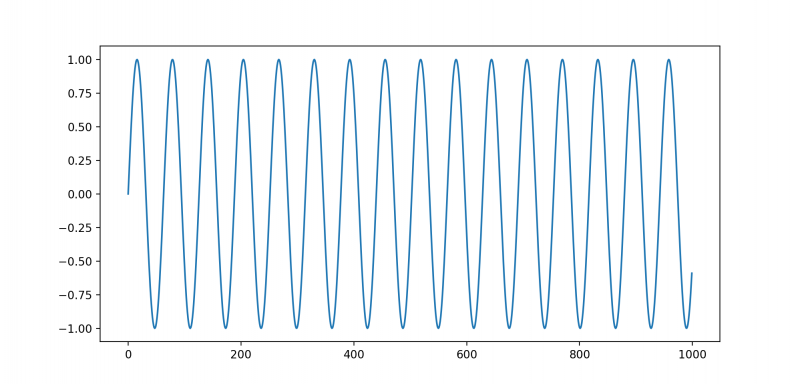
とりあえずサインカーブを書いてみます.
1 2 3 4 5 6 7 8 9 10 11 12 13 14 15 16 17 18 19 20 21 22 23 | #include <iostream> #include <cmath> #include "matplotlibcpp.h" namespace plt = matplotlibcpp; using namespace std; int main() { int n = 1000; vector<double> x(n), y(n); for(int i = 0; i < n; ++i){ x[i] = i; y[i] = sin(0.1 * i); } plt::plot(x, y); plt::show(); return 0; } |
凡例をつける
複数のグラフを描画する際には,グラフに凡例を付けたいときがあります.
1 2 3 4 5 6 7 8 9 10 11 12 13 14 15 16 17 18 19 20 21 22 23 24 25 26 27 | #include <iostream> #include <cmath> #include "matplotlibcpp.h" namespace plt = matplotlibcpp; using namespace std; int main() { int n = 1000; vector<double> x(n), y(n), z(n); for(int i = 0; i < n; ++i){ x[i] = i; y[i] = sin(0.1 * i); z[i] = 0.05 * i - 3; } plt::named_plot("sin(0.1x)", x, y); plt::named_plot("0.05x-3", x, z); plt::legend(); plt::show(); return 0; } |
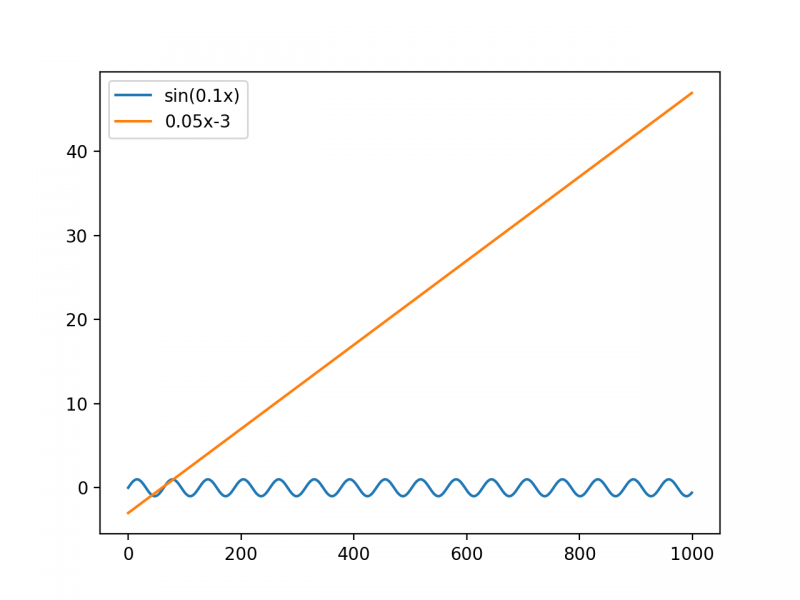
このように named_plot() を使うか,mapを使って実際のmatplotilbの引数名に値を渡すことで解決できます.
また,この際色々なグラフオプションを利用可能です.
1 2 3 4 5 6 7 8 9 10 11 12 13 14 15 16 17 18 19 20 21 22 23 24 25 26 27 28 29 30 31 32 33 34 35 36 | #include <iostream> #include <cmath> #include "matplotlibcpp.h" namespace plt = matplotlibcpp; using namespace std; int main() { int n = 1000; vector<double> x(n), y(n), z(n); for(int i = 0; i < n; ++i){ x[i] = i; y[i] = sin(0.1 * i); z[i] = 0.05 * i - 3; } map<string, string> args1{ {"label", "sin(0.1x)"}, {"c", "blue"} }; plt::plot(x, y, args1); map<string, string> args2{ {"label", "0.05x-3"}, {"c", "red"} }; plt::plot(x, z, args2); plt::legend(); plt::show(); return 0; } |
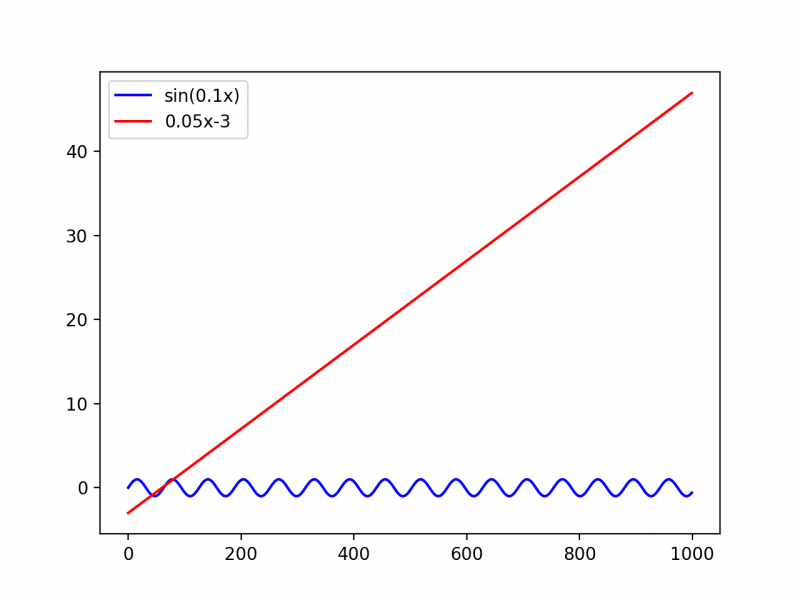
複数グラフの描画
複数のグラフを別々で描画したいときは,Pythonのmatplotlib同様, subplot が使用できます.
1 2 3 4 5 6 7 8 9 10 11 12 13 14 15 16 17 18 19 20 21 22 23 24 25 26 27 28 29 30 31 | #include <iostream> #include <cmath> #include "matplotlibcpp.h" namespace plt = matplotlibcpp; using namespace std; int main() { int n = 1000; vector<double> x(n), y(n), z(n); for(int i = 0; i < n; ++i){ x[i] = i; y[i] = sin(0.1 * i); z[i] = cos(0.05 * i); } plt::subplot(2, 1, 1); plt::ylabel("sin()"); plt::plot(x, y); plt::subplot(2, 1, 2); plt::ylabel("cos()"); plt::plot(x, z); plt::show(); return 0; } |
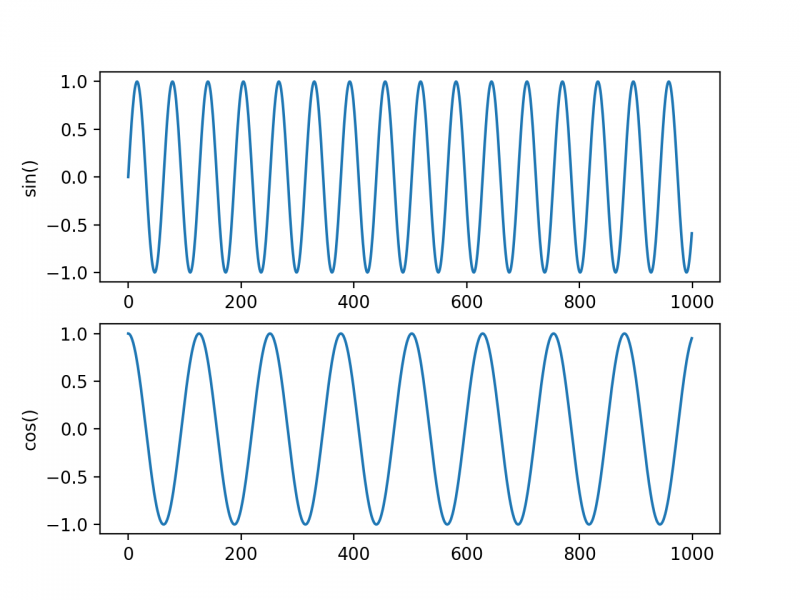
おわりに
今回はmatplotlib-cppという,PythonのmatplotlibをC++で呼びだすライブラリを紹介しました.
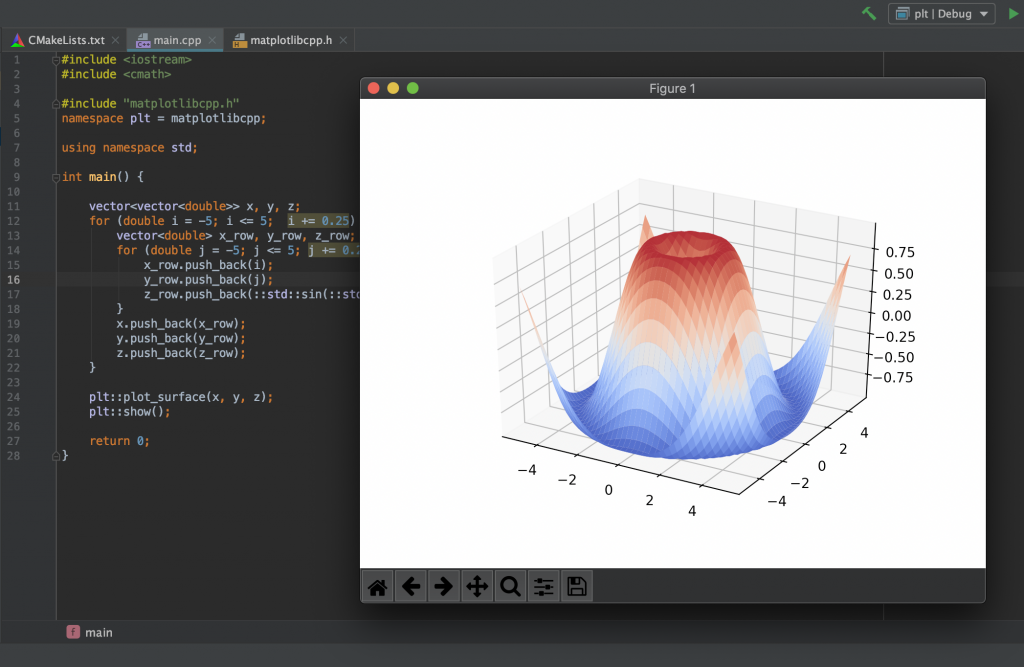
この記事では,基本的な機能しか紹介していませんが,サムネでもあるような3Dグラフも描画できます.
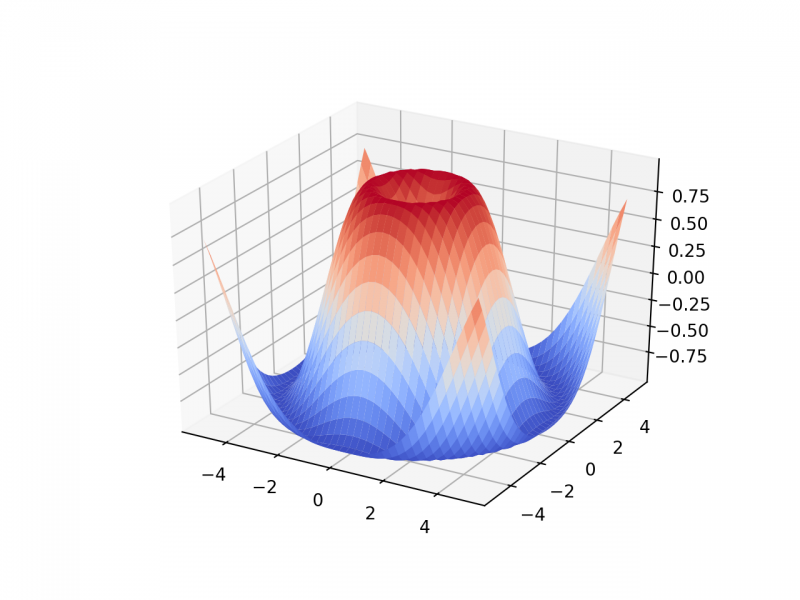
他にも,両対数グラフ( loglog() )やヒストグラム( hist() ),エラーバー( errorbar() )なども描画可能です.
まあ,なんといってもmatplotlib-cppはC++にしては少量のコードでグラフを描画できるのが良い所だと思います.
まだ不具合も少しありますが,まだ頻繁に更新されていますので,これからさらに使い勝手が良くなるでしょう.
ヘッダオンリなのも僕は好きです.
みなさんも使ってみては?


